Traditional infographics often create significant barriers for users with visual impairments and those who rely on assistive technologies. Yes, they are visually appealing and allow you to show information in an interesting way, but they still frequently shut out large segments of your audience.
Thankfully, it’s not completely impossible to create infographics that maintain visual impact while being fully accessible – you just need expertise and the right tools. That’s easier said than done, though – most resources address either accessibility or infographic design, but rarely both together effectively.
At The A11Y Collective, we understand both the visual and technical requirements, and today, we’ll show you our approach to creating infographics that meet WCAG requirements while providing truly inclusive user experiences.
We focus exclusively on web-based infographics rather than PDFs or print materials, with techniques that not only satisfy accessibility standards but also create more effective infographics that work better for everyone.
Building accessible infographics: a step-by-step approach
Creating web infographics that everyone can access and understand can be tricky, but if you follow these guidelines, you can ensure your visual content reaches the widest possible audience, including people with disabilities.
🤓 While some of these principles are universal, we will be focusing (for obvious reasons) on infographics. If you want to learn more about other visuals, check out this W3C guide about making different image types accessible.
Simple design
Simplicity is the foundation of accessible infographic design (or any design, if you ask us). A clean, uncluttered layout helps all users focus on what matters most – your core message. Start by identifying the single most important takeaway you want readers to remember, then build your visual around this central point.
When tackling complex topics, break information into digestible sections with ample white space between elements. This separation creates visual breathing room and helps users process information in manageable chunks.
For maximum effectiveness:
- Limit data points or concepts to 5-7 per infographic.
- Remove purely decorative elements that don’t enhance understanding.
- Use consistent visual patterns to reduce cognitive load.
Logical structure
A logical structure acts as an invisible guide, leading users through your content in a meaningful sequence. Create a clear visual hierarchy where the most important information stands out and supporting details follow naturally. This approach benefits everyone, but it’s particularly crucial for screen reader users who need content organised in a sensible reading order.
Your structure should:
- Follow a predictable pattern (typically top-to-bottom, left-to-right).
- Group related information using proximity, borders, or background colours.
- Include clear section labels that aid navigation and understanding.
- Maintain consistent heading levels to establish information priority.
Text
Text choices dramatically impact how accessible your infographic will be. Sans-serif fonts like Arial, Verdana, and Open Sans offer superior screen readability and should be sized at a minimum of 14pt for body text.

This ensures legibility for users with mild visual impairments and improves the experience for everyone viewing on smaller screens.
The main point is to avoid stylistic choices that create barriers, such as all-caps text, italics, and decorative fonts. These may look interesting, but they significantly reduce readability. You should also keep text horizontal whenever possible, as angled or vertical text creates difficulties for many users with cognitive impairments.
Alt text and transcripts
Effective alt text forms the foundation of accessible images, but complex visuals require more comprehensive solutions. While simple alt text works for basic images, infographics packed with data, trends, and relationships need detailed text alternatives to ensure all users can access the information.
Not sure how to write good alt text for general images? Check out our guide on descriptive alternative text!
For complex infographics containing substantial information – charts, diagrams, maps, or data visualisations – you must provide comprehensive text transcripts. These transcripts should capture both the visual structure and the data relationships that give the infographic meaning.
When creating transcripts for complex visuals:
- Describe the overall structure and organisation first.
- Detail key data points and their relationships.
- Highlight trends, patterns, and conclusions.
- Include any essential context provided by visual elements.
- Maintain a logical reading order that reflects the visual flow.
Several effective methods exist for implementing these text alternatives:
- Place the transcript directly beneath the infographic as visible text.
- Create expandable/collapsible sections that preserve your page layout.
- Link to a separate page containing the full transcript.
- Use ARIA techniques like
aria-describedbyto associate descriptions with images.
Colour and contrast
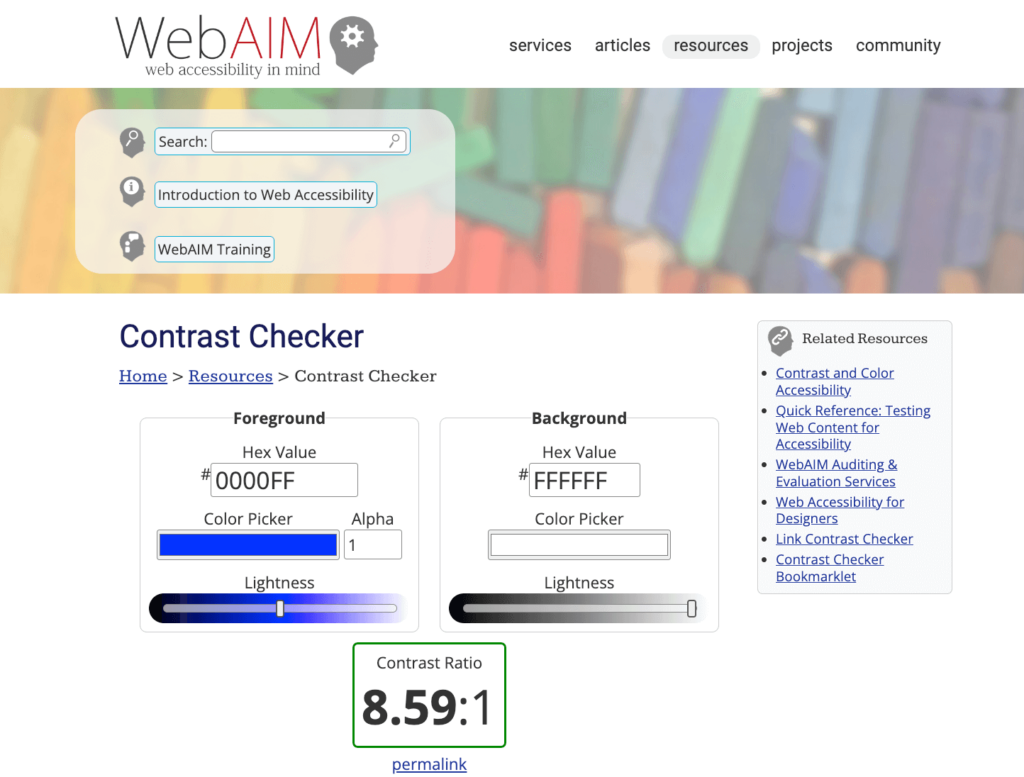
Proper colour implementation is critical for accessible infographics. Always maintain a 4.5:1 minimum contrast ratio between text and background to ensure readability for users with low vision or colour blindness.
Never rely on colour alone to convey meaning. When using colour to differentiate data points in charts or highlight important information, always add redundant visual cues such as patterns, textures, shapes, or labels that communicate the same information.
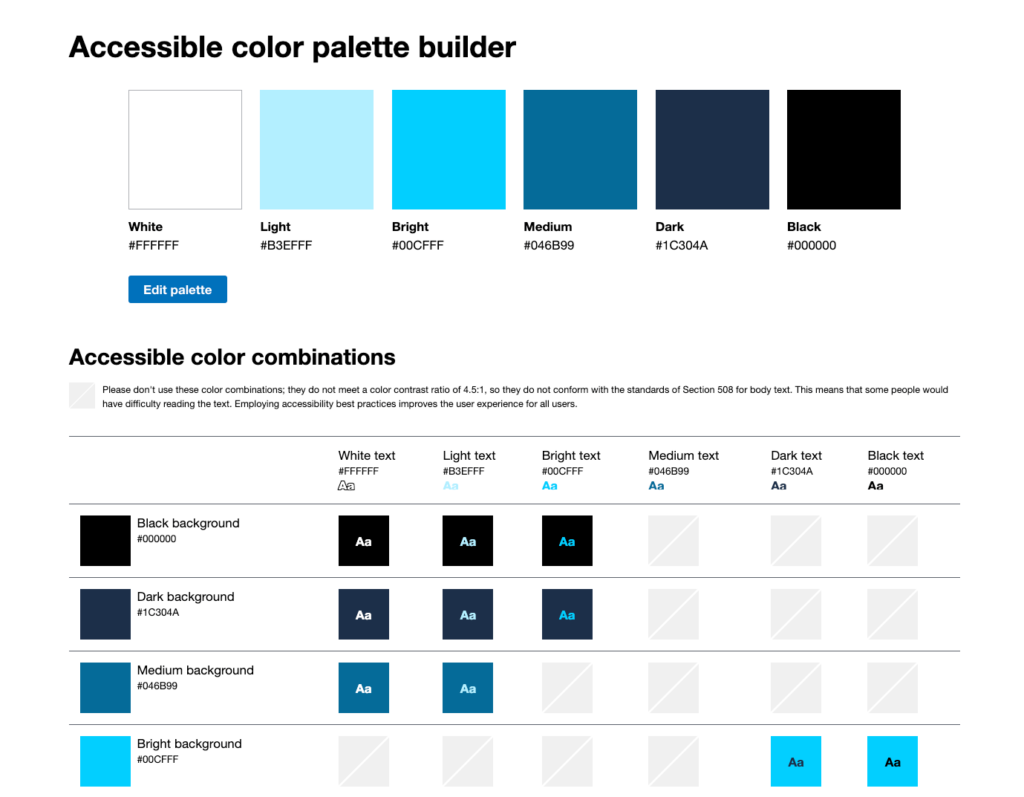
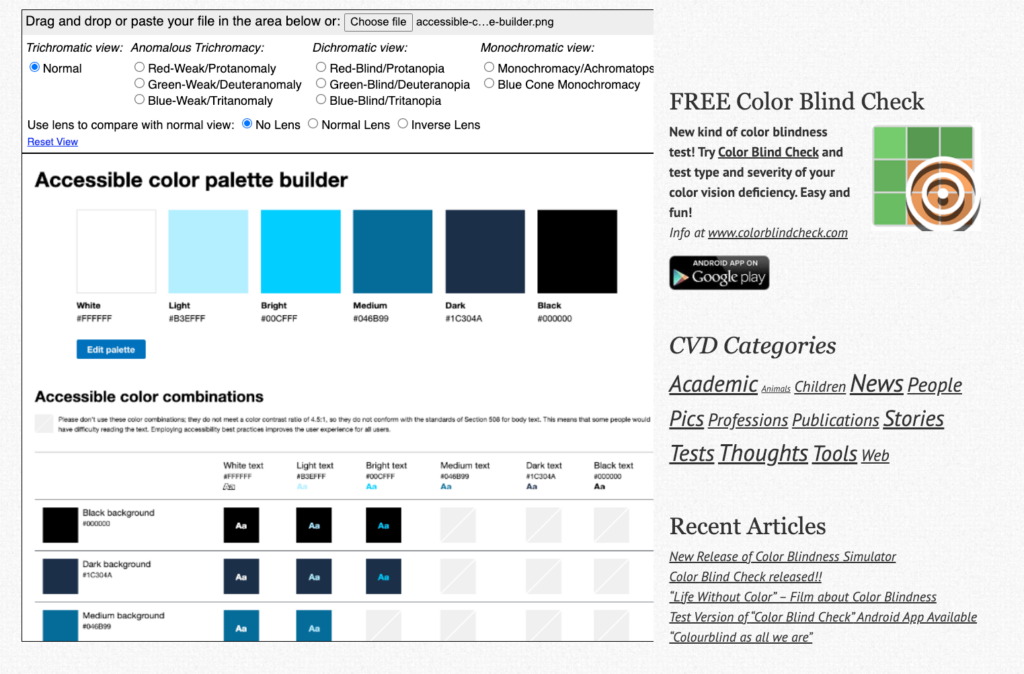
It’s also recommended that you limit your colour palette to 3-5 colours maximum to reduce cognitive load and improve comprehension for all users. Choose colours that provide strong differentiation – not just in hue but also in lightness values – to maximise accessibility across the broadest range of visual abilities.
If you’re stuck on choosing a colour palette, you can try out this really handy Accessible Colour Palette Builder, which tells you exactly which combinations work well and if the text-to-background contrast is enough.
Animation
Strategic animation can enhance infographic comprehension, but it must be implemented thoughtfully to avoid creating barriers. First and foremost, you need to limit animation speed and frequency to prevent causing discomfort, seizures, or cognitive overload for users with vestibular disorders or attention sensitivities.
Other things you can do include:
- Always provide user controls to pause, stop, or hide any moving content on your infographics.
- Ensure no animations auto-play for more than 5 seconds without user control.
- Strictly avoid content that flashes more than three times per second to prevent triggering photosensitive reactions.
- Include static alternatives that convey the same information as animated elements. This ensures users who disable animations or use assistive technologies can still access your complete message.
When used properly, animation should enhance understanding of data relationships and processes – never serve as mere decoration.
Links
Creating accessible links within your infographics ensures all users can navigate and interact with your content efficiently.
First, you need to think about how your infographics are viewed. On desktop, the users can navigate and click on the links with their preferred device – keyboard, for example. However, on mobile devices like tablets and phones, they need to click on them. So, to make them actually usable, all clickable areas should be a minimum of 24×24 pixels to accommodate users with motor impairments who may struggle with precision movements. The bigger the click targets the easier they are to hit!
Next, always use descriptive link text that clearly communicates where the link leads, avoiding vague phrases like “click here” or “read more” that provide no context for screen reader users. For example, use “Download the complete accessibility report” rather than “Download here.”
Make link states visually distinct through colour, underlines, or other visual indicators to show normal, hover, active, and visited states. This provides critical visual feedback for all users. Additionally, ensure all interactive elements are accessible via keyboard navigation for users who cannot use a mouse.
Mobile display
Begin your design process with responsive principles, ensuring your infographic adapts seamlessly across devices rather than attempting to retrofit accessibility later.
Test your infographics thoroughly on multiple screen sizes and orientations to verify that content remains legible and interactive elements function correctly. For particularly complex visualisations, consider creating simplified versions specifically optimised for mobile viewers.
Ensure all tap targets are adequately sized (also minimum 24×24 pixels) and sufficiently spaced to prevent accidental taps. Optimise file sizes by using appropriate compression techniques and modern image formats like WEBP to ensure faster loading times on mobile networks, which benefits all users but is particularly crucial for those with data limitations.
HTML and CSS
Building infographics with HTML and CSS rather than as static images creates inherently more accessible content. This approach allows assistive technologies to interpret your information correctly and gives users more control over how content is displayed.
Use semantic HTML elements like headings, lists, and tables to structure your content logically, providing clear navigation paths for screen reader users. Implement CSS for layout and styling rather than relying on image-only infographics that cannot be interpreted by assistive technologies.
Consider SVG (Scalable Vector Graphics) format for your visual elements – they’re lightweight, infinitely scalable without quality loss, and can include built-in text alternatives. SVGs can also be styled with CSS and made interactive with JavaScript, offering greater flexibility while maintaining accessibility for all users.
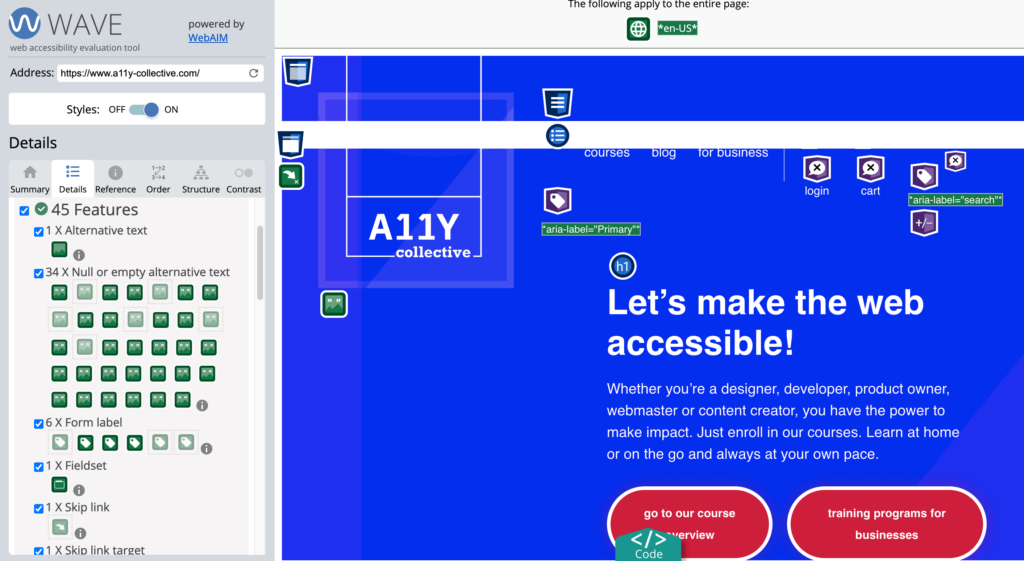
Testing your infographics for accessibility
Creating accessible infographics is just the beginning – next, you need to test whether they actually work for all users. Start by measuring against Web Content Accessibility Guidelines (WCAG) 2.1 AA compliance standards, which provide clear benchmarks for accessibility success.
Leverage specialised testing tools to identify potential barriers:
- Verify colour contrast ratios meet minimum standards using WebAIM’s Contrast Checker.
- Test your colour schemes with colour blindness simulators like Coblis to ensure information remains clear across different vision types.
While automated tools provide valuable insights, manual testing is essential for comprehensive evaluation:
- Test with screen readers (NVDA, JAWS, VoiceOver for Mac) to experience your content as blind users would.
- Verify functionality across multiple devices, browsers, and screen sizes.
- Navigate your infographics using only keyboard commands to ensure all interactive elements are accessible.
- Conduct test sessions with actual users who have disabilities – their real-world feedback often reveals issues automated testing misses.
For organisations serious about accessibility compliance, consider a full web accessibility audit. Accessibility is a complex issue, so this evaluation is built to examine not just individual infographics but how they integrate within your broader digital ecosystem, identifying systemic issues that might otherwise go undetected.
Elevate your accessible design skills with expert training
Hopefully, with these guidelines, you now know how to create infographics that are visually appealing and accessible to people with diverse abilities. This method increases your audience and ensures that your message resonates with everyone.
But knowing the principles and implementing them effectively are two different challenges. That’s where dedicated training bridges the gap.
The A11Y Collective’s “Accessible Design, the basics” course transforms accessibility guidelines from abstract concepts into practical skills you can apply immediately. Unlike generic tutorials, this focused training builds directly on the fundamentals covered in this article, taking your understanding to the implementation level.
The course delivers practical expertise in:
- Creating colour schemes that meet contrast requirements while maintaining visual appeal.
- Selecting typography that enhances readability across different abilities.
- Designing intuitive navigation patterns that work for all users.
- Structuring layouts that maintain clarity regardless of how they’re accessed.
And, as an IAAP-certified program, this training adds professional credentials to your skillset, increasingly valuable as accessibility requirements become standard across industries.
Ready to transform your approach to accessible infographics? Enrol in our Accessible design course today and become the accessibility expert your organisation needs.

Ready to get started?
Transforms accessibility guidelines into practical skills you can apply immediately.